WIND POWER ENERGY
WHY OFF-GRID WIND
Starting with the basics, a wind turbine converts kinetic energy in the wind to electrical power. Considering the equation below, the more dense the wind, the higher the wind speed, and the larger the rotor area, the more power that is captured.
Power= ½ x Air Density x Wind Velocity^3 x Rotor Area
While maximizing the rotor seems like a favorable option, wind turbine cost escalates as a function of the rotor area. In analyzing weather data in detail, the following conclusions can be drawn relative to wind power generation:
- Average wind speeds are highest during wintertime
- Colder, wintertime air is more dense and increases power generation, particularly in northern climates with frigid winters
- Stormy, inclement and poor weather has a reduced solar resource, and an increased wind resource
- Wind is highly variable, but statistically speaking, blows as often at night as during the day which reduces the severity in depth of battery discharge (significantly extending battery life)
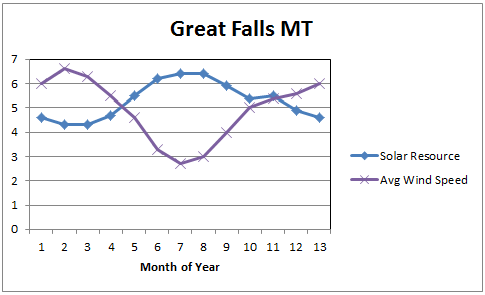
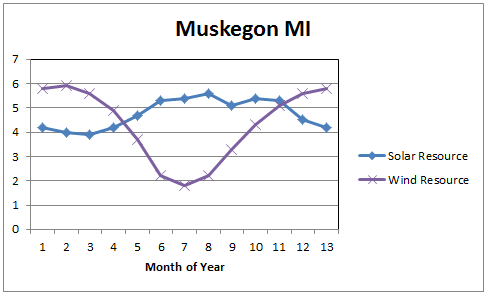
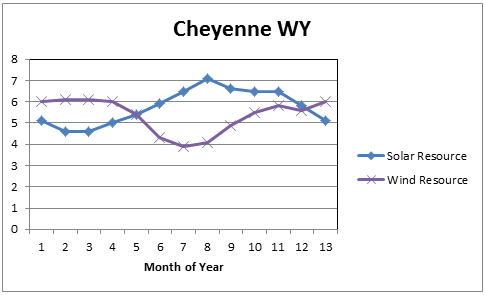
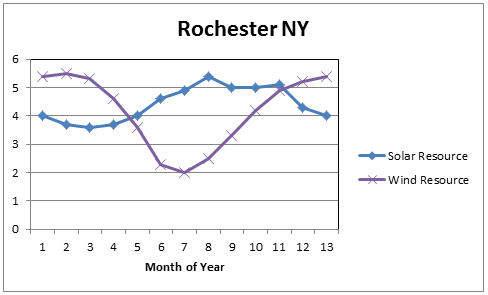
- WINTERTIME WIND COMPLIMENT SOLAR’S LIMITATIONS
Below are several instances of solar and wind resources over the course of a calendar year. Note that some regions are more complimentary than others.
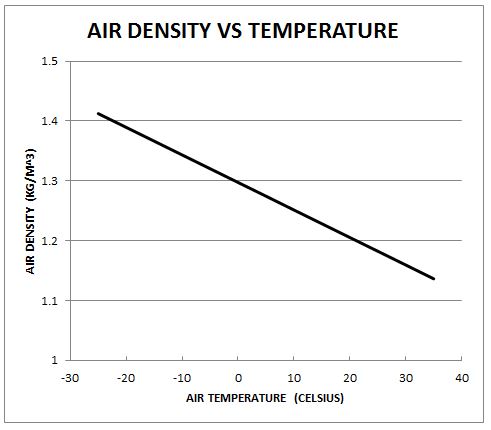
2. AIR DENSITY
As wintertime air becomes colder and colder, it also becomes more dense. Denser air provides greater loads on the turbine blades thereby creating more power. During those winter months when solar may struggle to keep the batteries charged, the air density is at its maximum. The more extreme the weather, the more wind generated power makes its way to the battery bank.
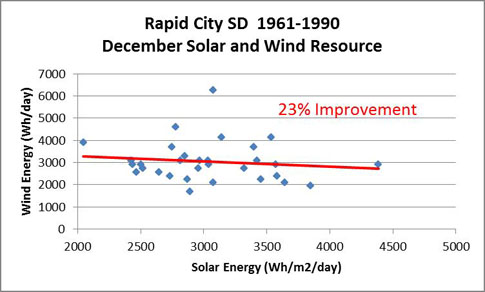
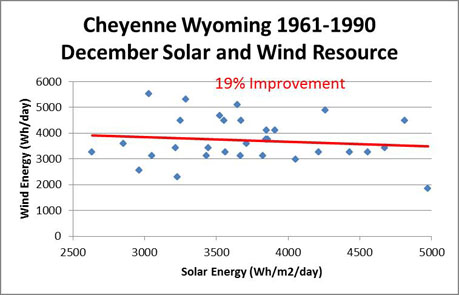
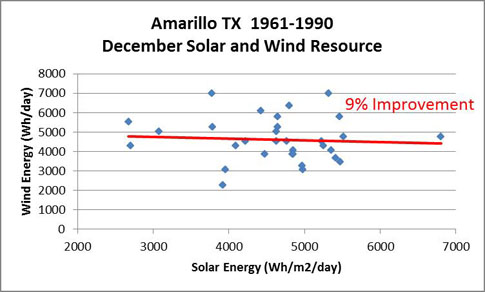
3. INCLEMENT WEATHER
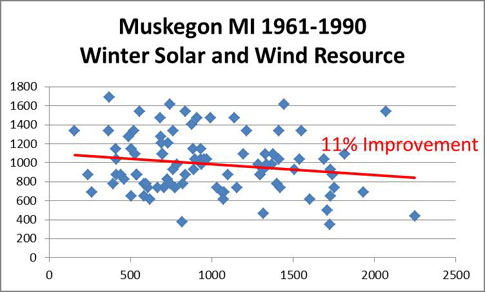
The National Renewable Energy Laboratory compiled solar and wind data from 1961-1990, and again from 1990-2010. This extensive availability of data allows trends in weather data to be analyzed. For instance, one anecdotal theory is that the wind blows when the sun does not shine. Our finding is that while Mother Nature does not categorically abide by this principle, there is a perceivable trend that less sunny groupings of time are indeed typically more windy. The graphs below shows several NREL test locations. Each data point represents the month of December in total for a particular year. Thus, there are 30 data points on each graph. When a trend line is placed through the data, it shows there is a slope which supports that months with less sun experience more wind.
4. NIGHT TIME ENERGY
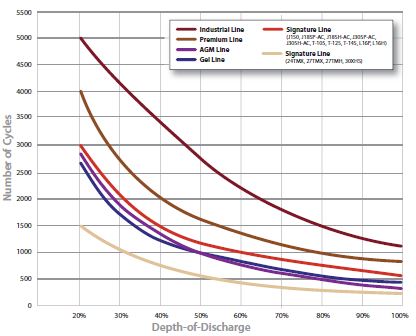
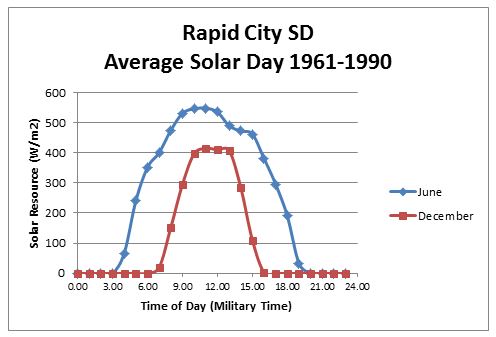
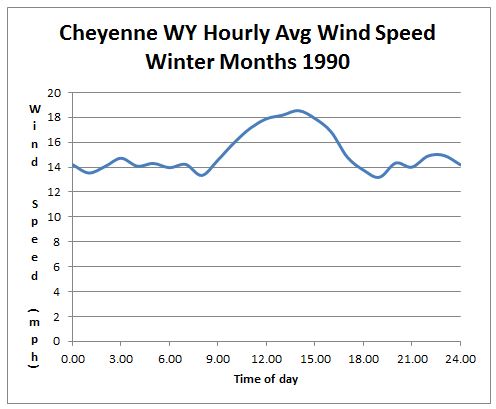
In most off-grid systems, deep cycle batteries are used. Battery manufacturers, in this case Trojan, publish data that correlate battery life to Depth of Discharge. In reviewing NREL solar data, in this case Rapid City, South Dakota, the average solar day for December and June are listed. It is widely known that far more sun hours are harvested in June than in December, but also important is the day length. Note that the December curve has its last significant power production around 3PM. The next significant power production occurs the following day at approximately 8AM. This leaves 17 hours without sufficient power production while the battery continues to drain. This results in a peak-and-valley scenario, maximizing at battery full condition and minimizing at 8AM at the start of the solar day. Wind, statistically speaking, blows nearly equally throughout any 24 hour period.
Call 303.242.5820 | [email protected]